

Apple (AAPL) is reporting its latest fiscal numbers after the close of trading Wednesday. There is an expected number or consensus number of sell-side analysts and there is a so-called “whisper” number, which is higher. I don’t want to get into the fundamentals (or the weeds as technical analysts and kitchen workers call it) but I want to point out some new clues on the charts.
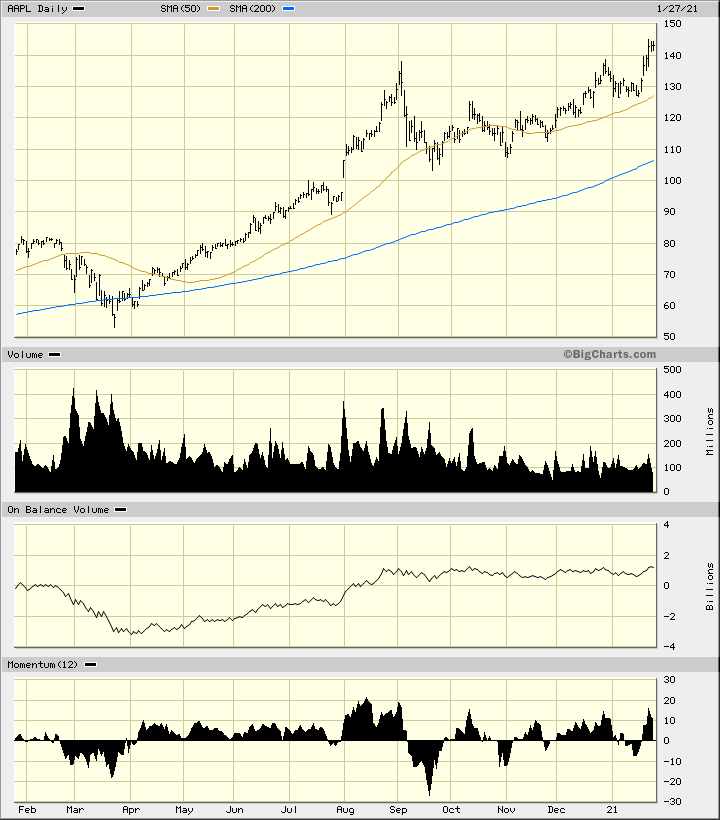
In this daily bar chart of AAPL, below, we can see that prices have made new highs for the move up this month. Prices looked like they were ready for an upside breakout of significance in late December, but another pullback unfolded into early January. Trading volume has been flat to slightly declining the past three months and the On-Balance-Volume (OBV) has been largely neutral since late August.
The 12-day price momentum study shows equal highs from December to January. This is a short period of time, but it still is a bearish divergence with prices making higher highs, but the indicator making only equal highs.
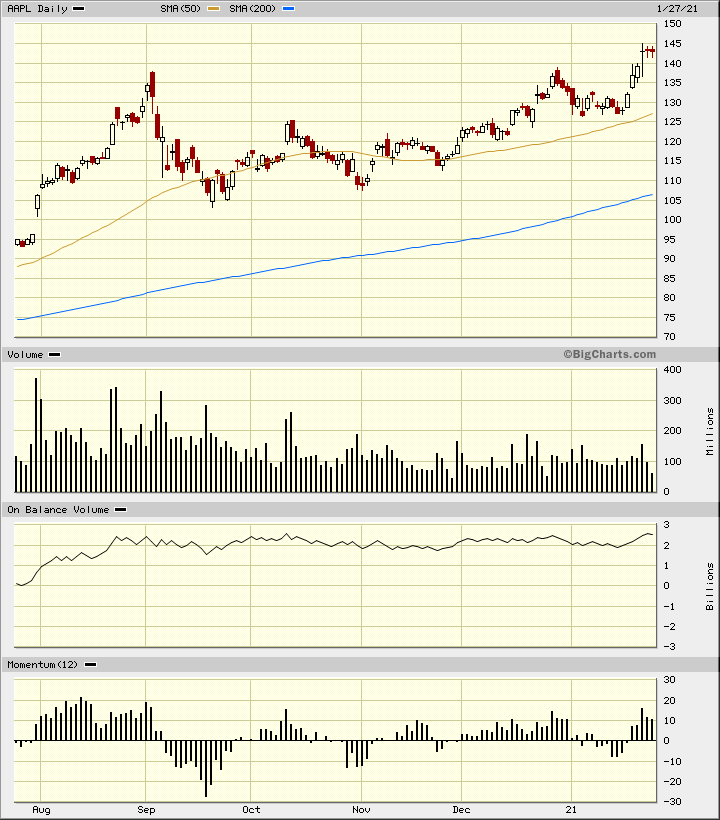
In this daily Japanese candlestick chart of AAPL, below, we can see a doji pattern on Monday and dojis or small spinning top patterns on Tuesday and today. Three days where there is very little movement from the open to the close. A very balanced condition. Weakness tomorrow could tip the scales to the bearish. A strong rally tomorrow would refresh the uptrend.
Bottom line strategy: Jim Cramer says to own AAPL and not trade it. That certainly has been wise advice. It may also be wise advice to sell down to a sleeping position on AAPL before today’s close.
Get an email alert each time I write an article for Real Money. Click the “+Follow” next to my byline to this article.


