

Bitcoin climbed to $58,330 this past week and could target a new high of $60k
Bitcoin (BTC) reached a new all-time high of $58,330 yesterday, a price level that saw BTC value equal to that of 1kg of gold. The upside also saw Bitcoin’s market capitalisation climb to $1.06 trillion, putting the crypto king among the top 10 assets per market cap across the globe. BTC is in the 8th spot currently, just behind Alphabet (Google).
The weekend, however, also saw resistance at the $58.5k level prove tough to break, with a slight retreat meaning that BTC registered a weekly close of $57,492.
Despite the setback, it appears fresh demand is set to see bulls rally higher. With on-chain volume growing, a new wave of buying pressure could easily propel BTC/USD to a new all-time high above $60,000.
Here’s the technical outlook for BTC/USD this week.
Bitcoin price technical picture
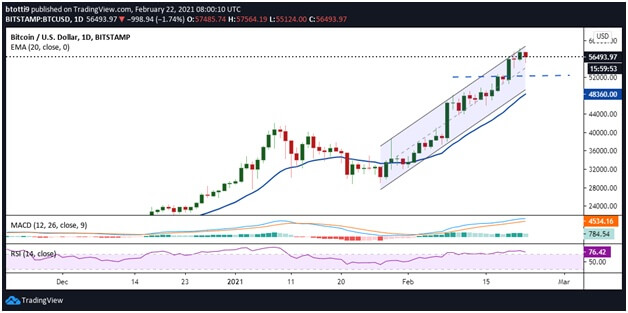
Bitcoin price remains above the middle line of the ascending channel recently formed on the daily chart. A break to the upper resistance line saw BTC/USD touch a new all-time high. It came after a Doji candlestick pattern formation that had indicated indecision resolved with a forceful upside.
As the chart shows, the price remains in an uptrend within the channel, and keeping prices above the middle line could allow bulls to target the upper limit once more. A break above the resistance line could extend to the $60,000 price level.
On the contrary, a dip to the channel support line could encourage bears to explore the $52,000 support level (blue dotted line). If they succeed in pushing past this level, the next target could be the 20-day exponential moving average ($48,360).

The hourly chart shows that bulls are struggling to keep prices above $56,000. The break to lows of $55,100 suggests bears have been aggressive during the early trading session. The hourly RSI slopping below 50 lent credence to this outlook. However, the indicator looks to be starting upwards and the MACD, which remains in the bullish zone, is suggesting a hidden positive divergence as the bearish perspective weakens.
Bulls need to hold onto gains above the 0.5 Fibonacci retracement level ($56,203) and sustain the upside momentum above a short-term descending trend line (red line) near $56,350. This move could open up a run to the 0.236 Fib level ($57,317) and leave bulls looking at the resistance presented by the all-time high.
A clear break above $58.3k could see BTC/USD trade towards a new record near $60,000.
On the downside, failure to establish control above the bearish trend line would leave bulls vulnerable to another dip. Below the 0.618 Fib level ($55,705), bears can target the 100-SMA (hourly chart) at $54,822. If the previous anchor at $54,094 folds, BTC/USD could dive to $51,487.


