

Bitcoin, Ethereum, Cryptocurrency, BTC/USD, ETH/USD – Talking Points:
- The long-term outlook for both Bitcoin and Ethereum remains skewed to the topside.
- However, bearish technical setups on multiple timeframes hint at further losses in the near term.

Recommended by Daniel Moss
Top Trading Lessons
The cryptocurrency market has come under fire in recent days, with Bitcoin and Ethereum both sinking lower as a wave of risk aversion sweeps across global financial markets. Although the longer-term outlook for both cryptocurrencies remains skewed to the topside, further losses look likely in the coming days. Here are the key technical levels to watch for BTC and ETH in the weeks ahead.
Bitcoin (BTC) Weekly Chart – Hanging Man Candle Hints at Further Downside
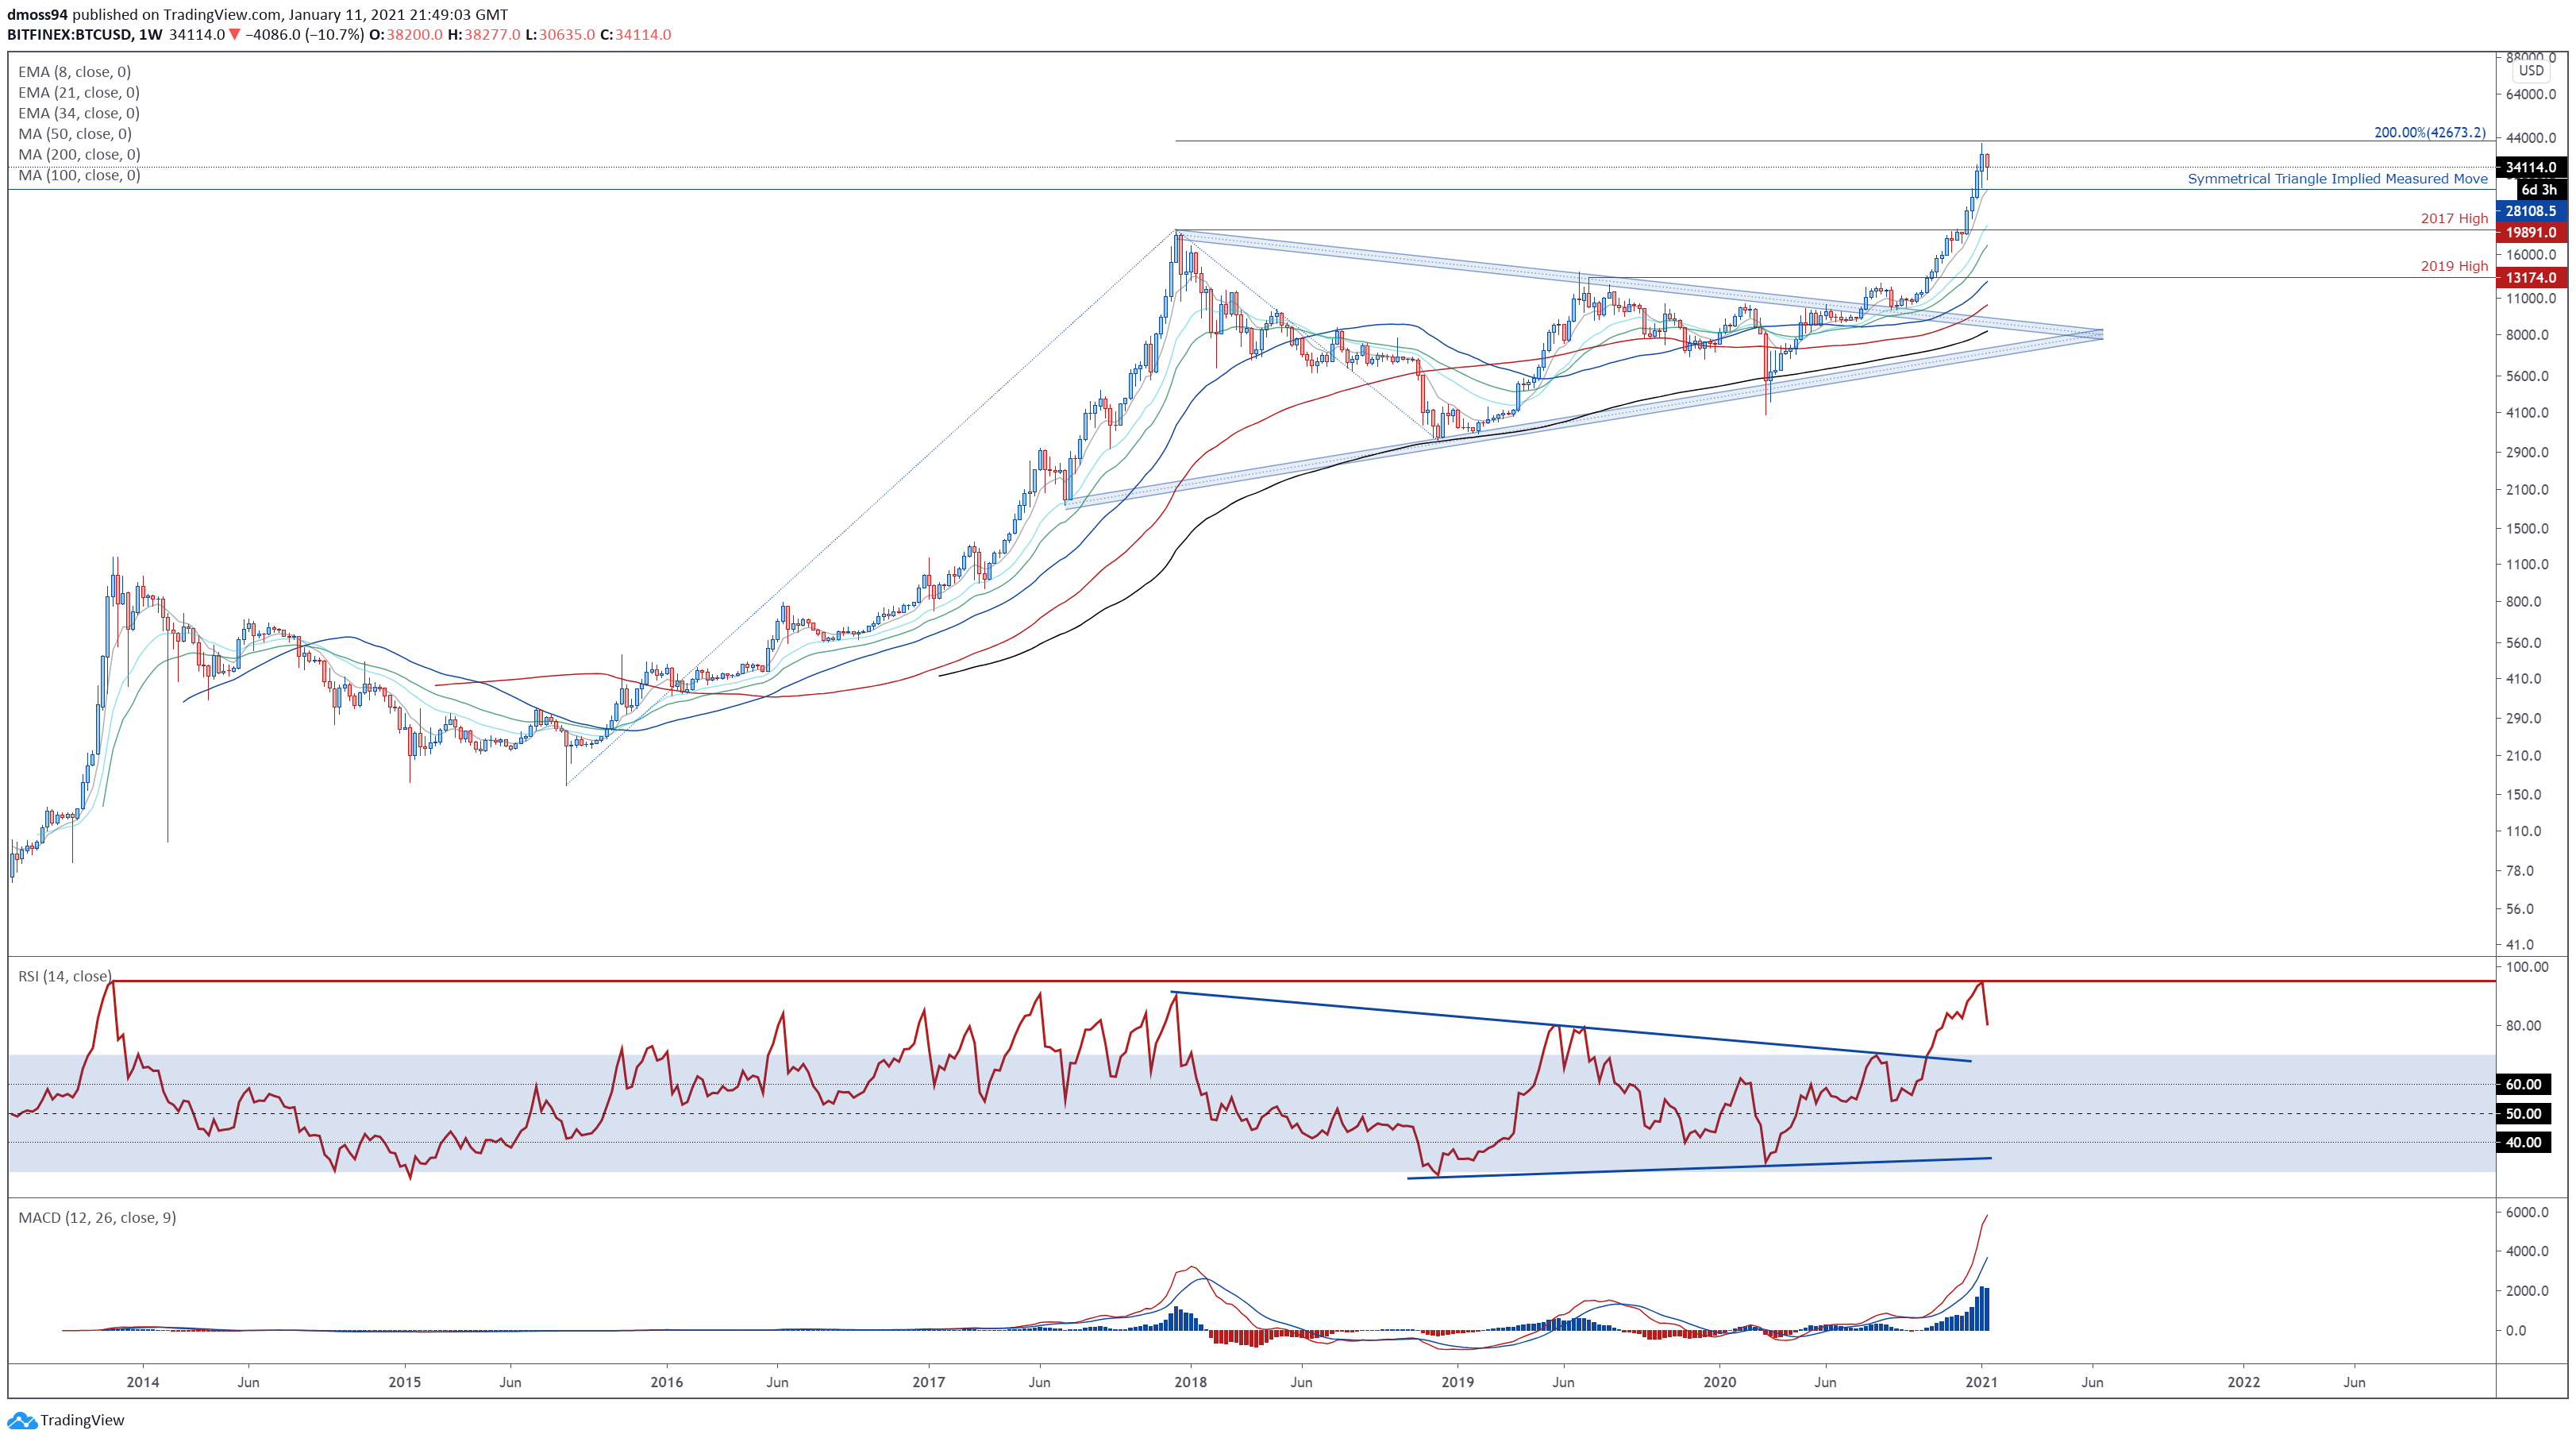
Bitcoin weekly chart created using Tradingview
Bitcoin’s staggering 949% surge from the March 2020 appears to be running out of steam, as price begins to form a bearish Hanging Man reversal candle just shy of key resistance at the 200% Fibonacci expansion (42673).
With the RSI notably U-turning at its highest weekly overbought readings since 2013, and prices tracking substantially above the 8-week exponential moving average (28108), a more extensive pullback looks likely in the near term.
Failing to gain a firm foothold above last week’s close (38200) would probably open the door for sellers to drive prices back towards psychological support at $30,000. Clearing that may pave the way for a push back towards former resistance-turned-support at the 2017 high (19891).
On the other hand, a weekly close above the 200% Fibonacci could signal the resumption of the primary uptrend and generate an impulsive topside push to challenge the $50,000 mark.
Bitcoin (BTC) Daily Chart – RSI Signals Swelling Bearish Momentum
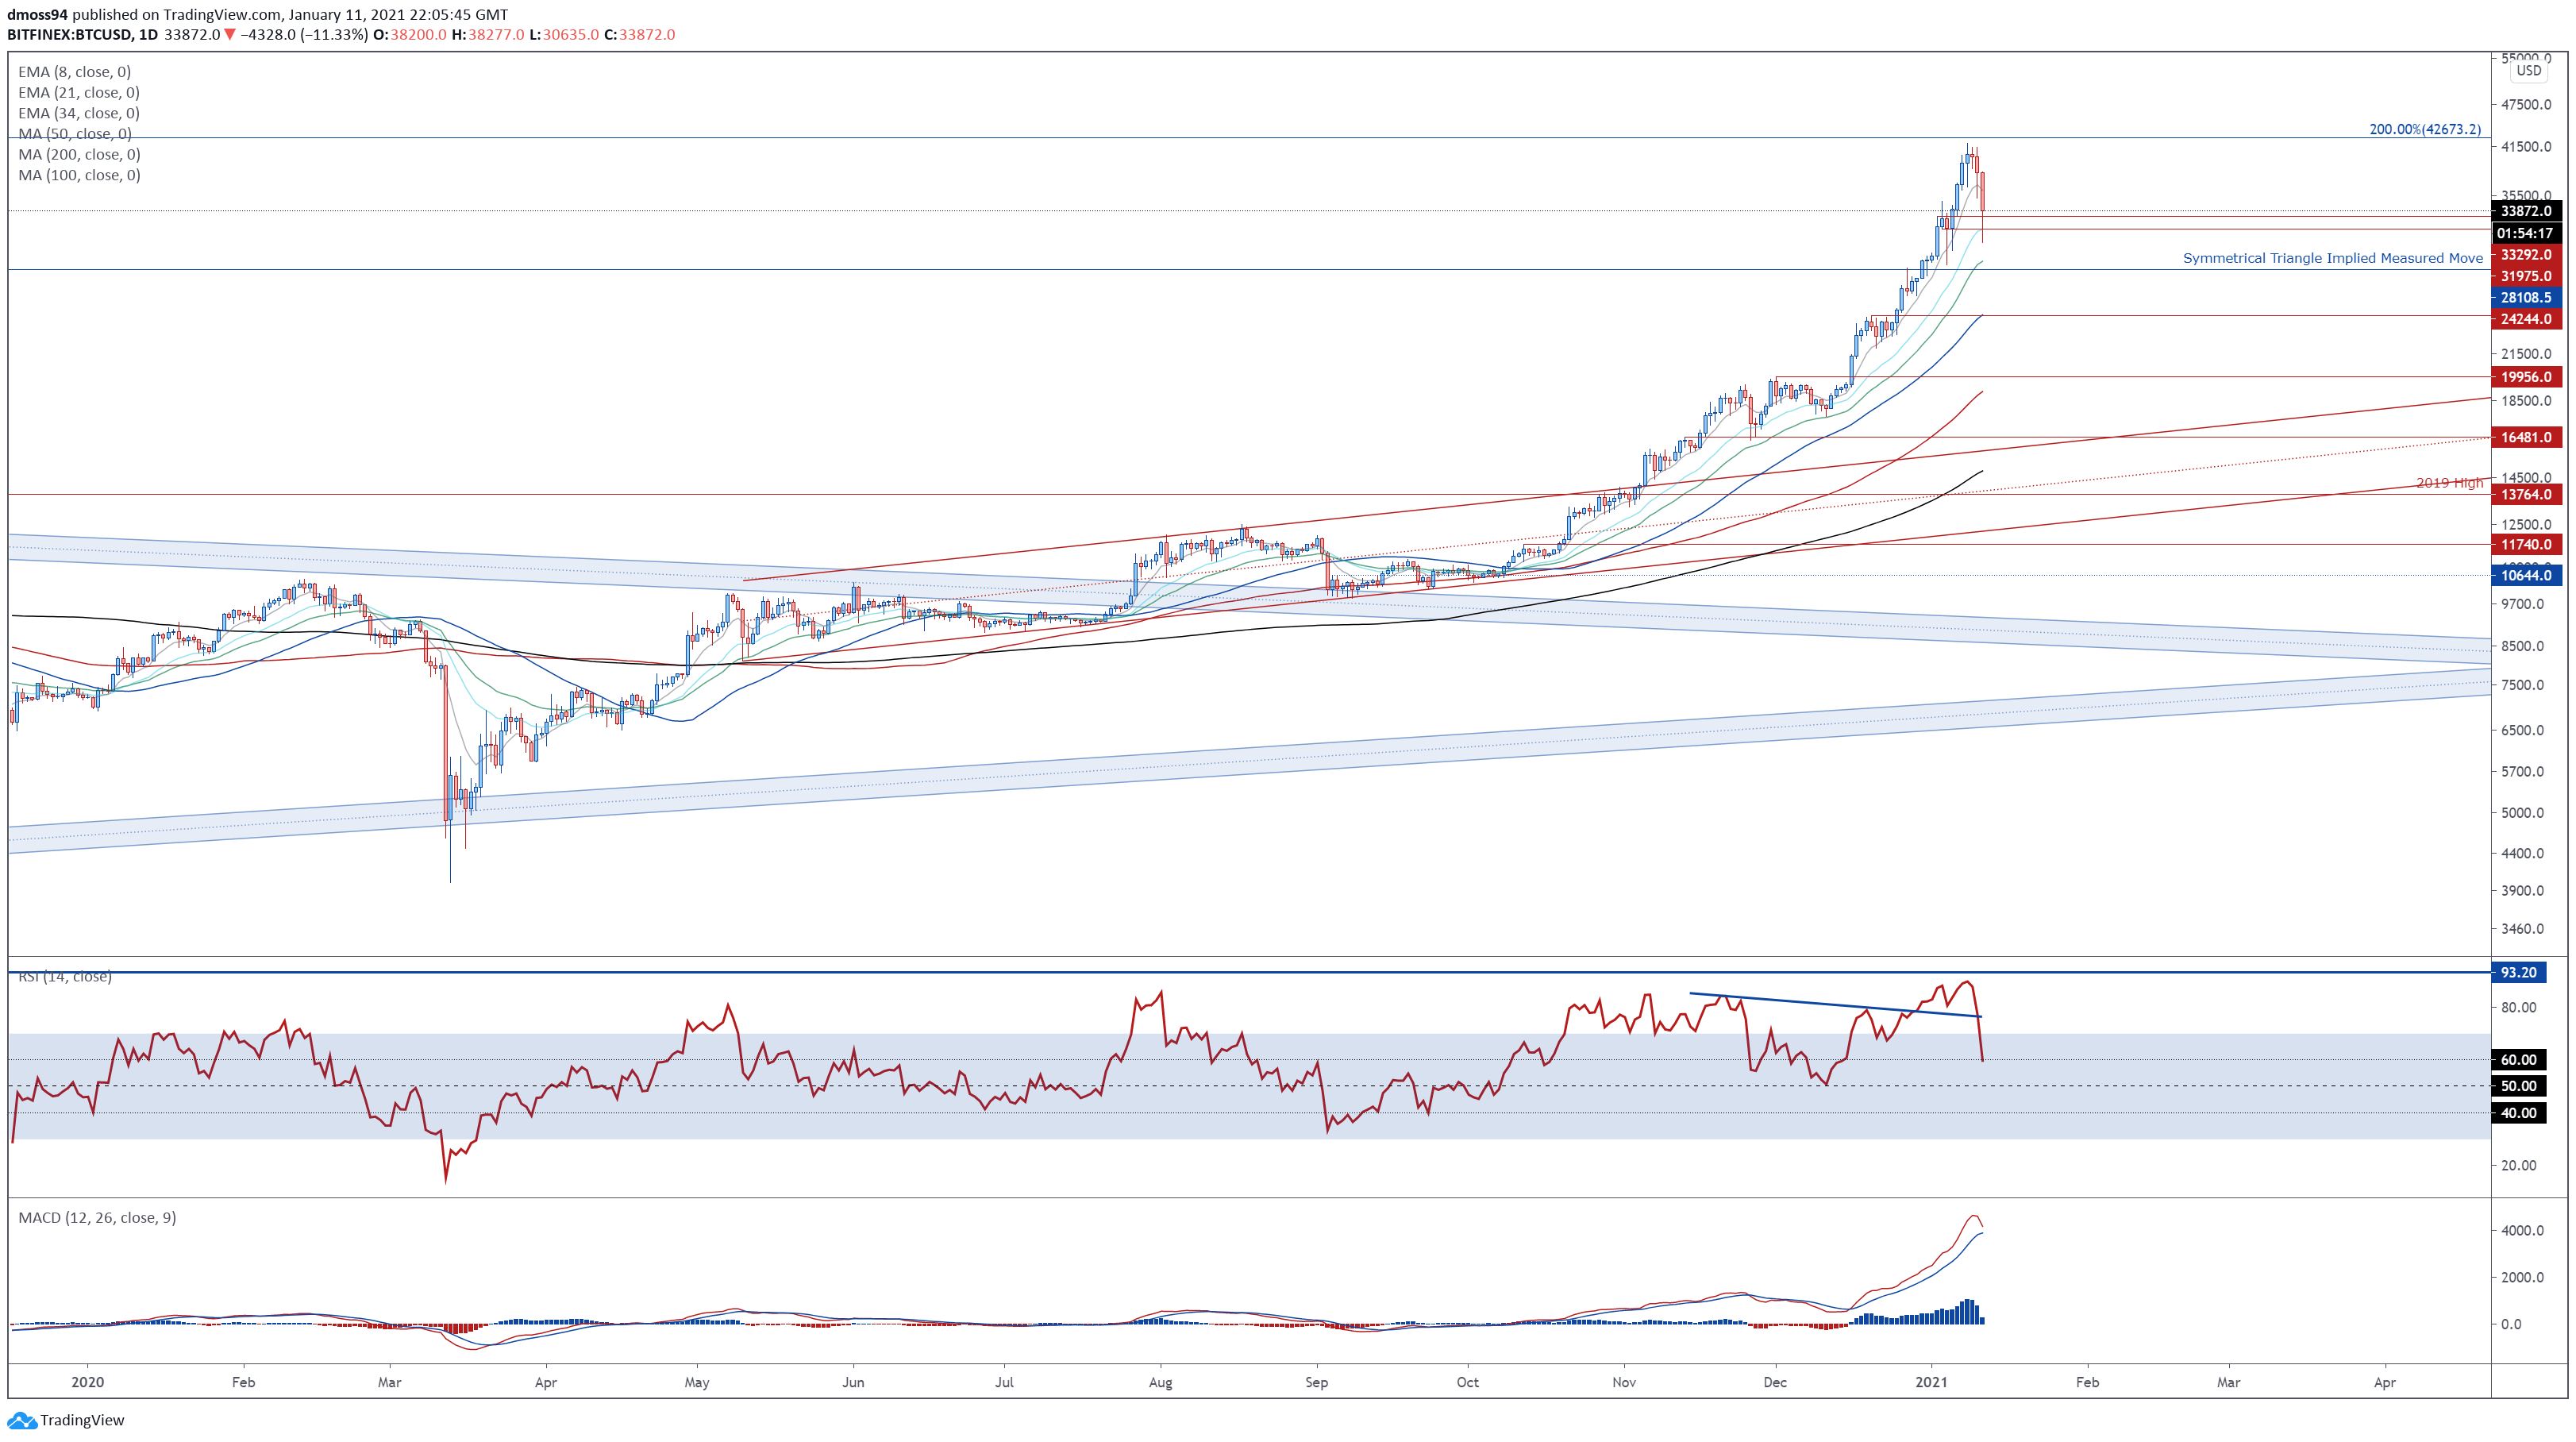
Bitcoin daily chart created using Tradingview
Zooming into a daily chart reinforces the relatively bearish outlook depicted on the weekly timeframe, at least in the near term, as prices slip back below the 8-day EMA (36318) and $35,000 mark.
With the RSI plunging back below 70, and the MACD eyeing a bearish cross below its ‘slower’ signal line counterpart, the path of least resistance seems skewed to the downside.
Clearing the support range at 31975 – 33290 would probably neutralize short-term buying pressure and generate a push to test confluent support at the 34-day EMA and the monthly low (28540). A daily close below the likely brings support at the December 20 high (24244) into the crosshairs.
Alternatively, remaining constructively perched above the 21-day EMA (32020) could ignite a rebound back towards the yearly high (41969).
| Change in | Longs | Shorts | OI |
| Daily | 6% | -17% | 1% |
| Weekly | 16% | -23% | 7% |
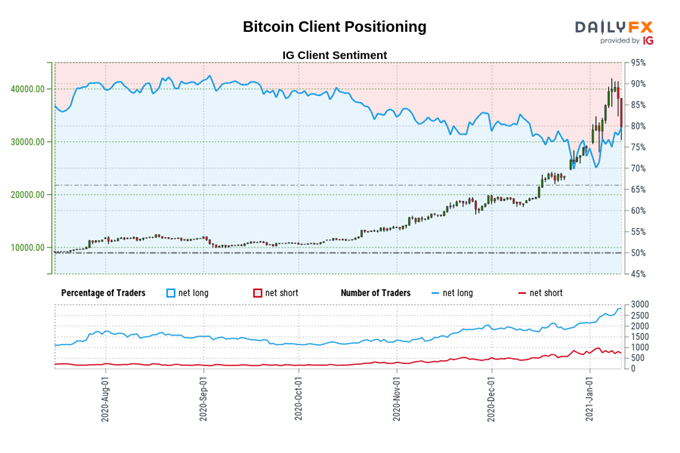
The IG Client Sentiment Report shows 83.69% of traders are net-long with the ratio of traders long to short at 5.13 to 1. The number of traders net-long is 5.24% lower than yesterday and 17.02% higher from last week, while the number of traders net-short is 31.97% lower than yesterday and 29.35% lower from last week.
We typically take a contrarian view to crowd sentiment, and the fact traders are net-long suggests Bitcoin prices may continue to fall.
Traders are further net-long than yesterday and last week, and the combination of current sentiment and recent changes gives us a stronger Bitcoin-bearish contrarian trading bias.
Ethereum (ETH) Weekly Chart – Double Top in Play?
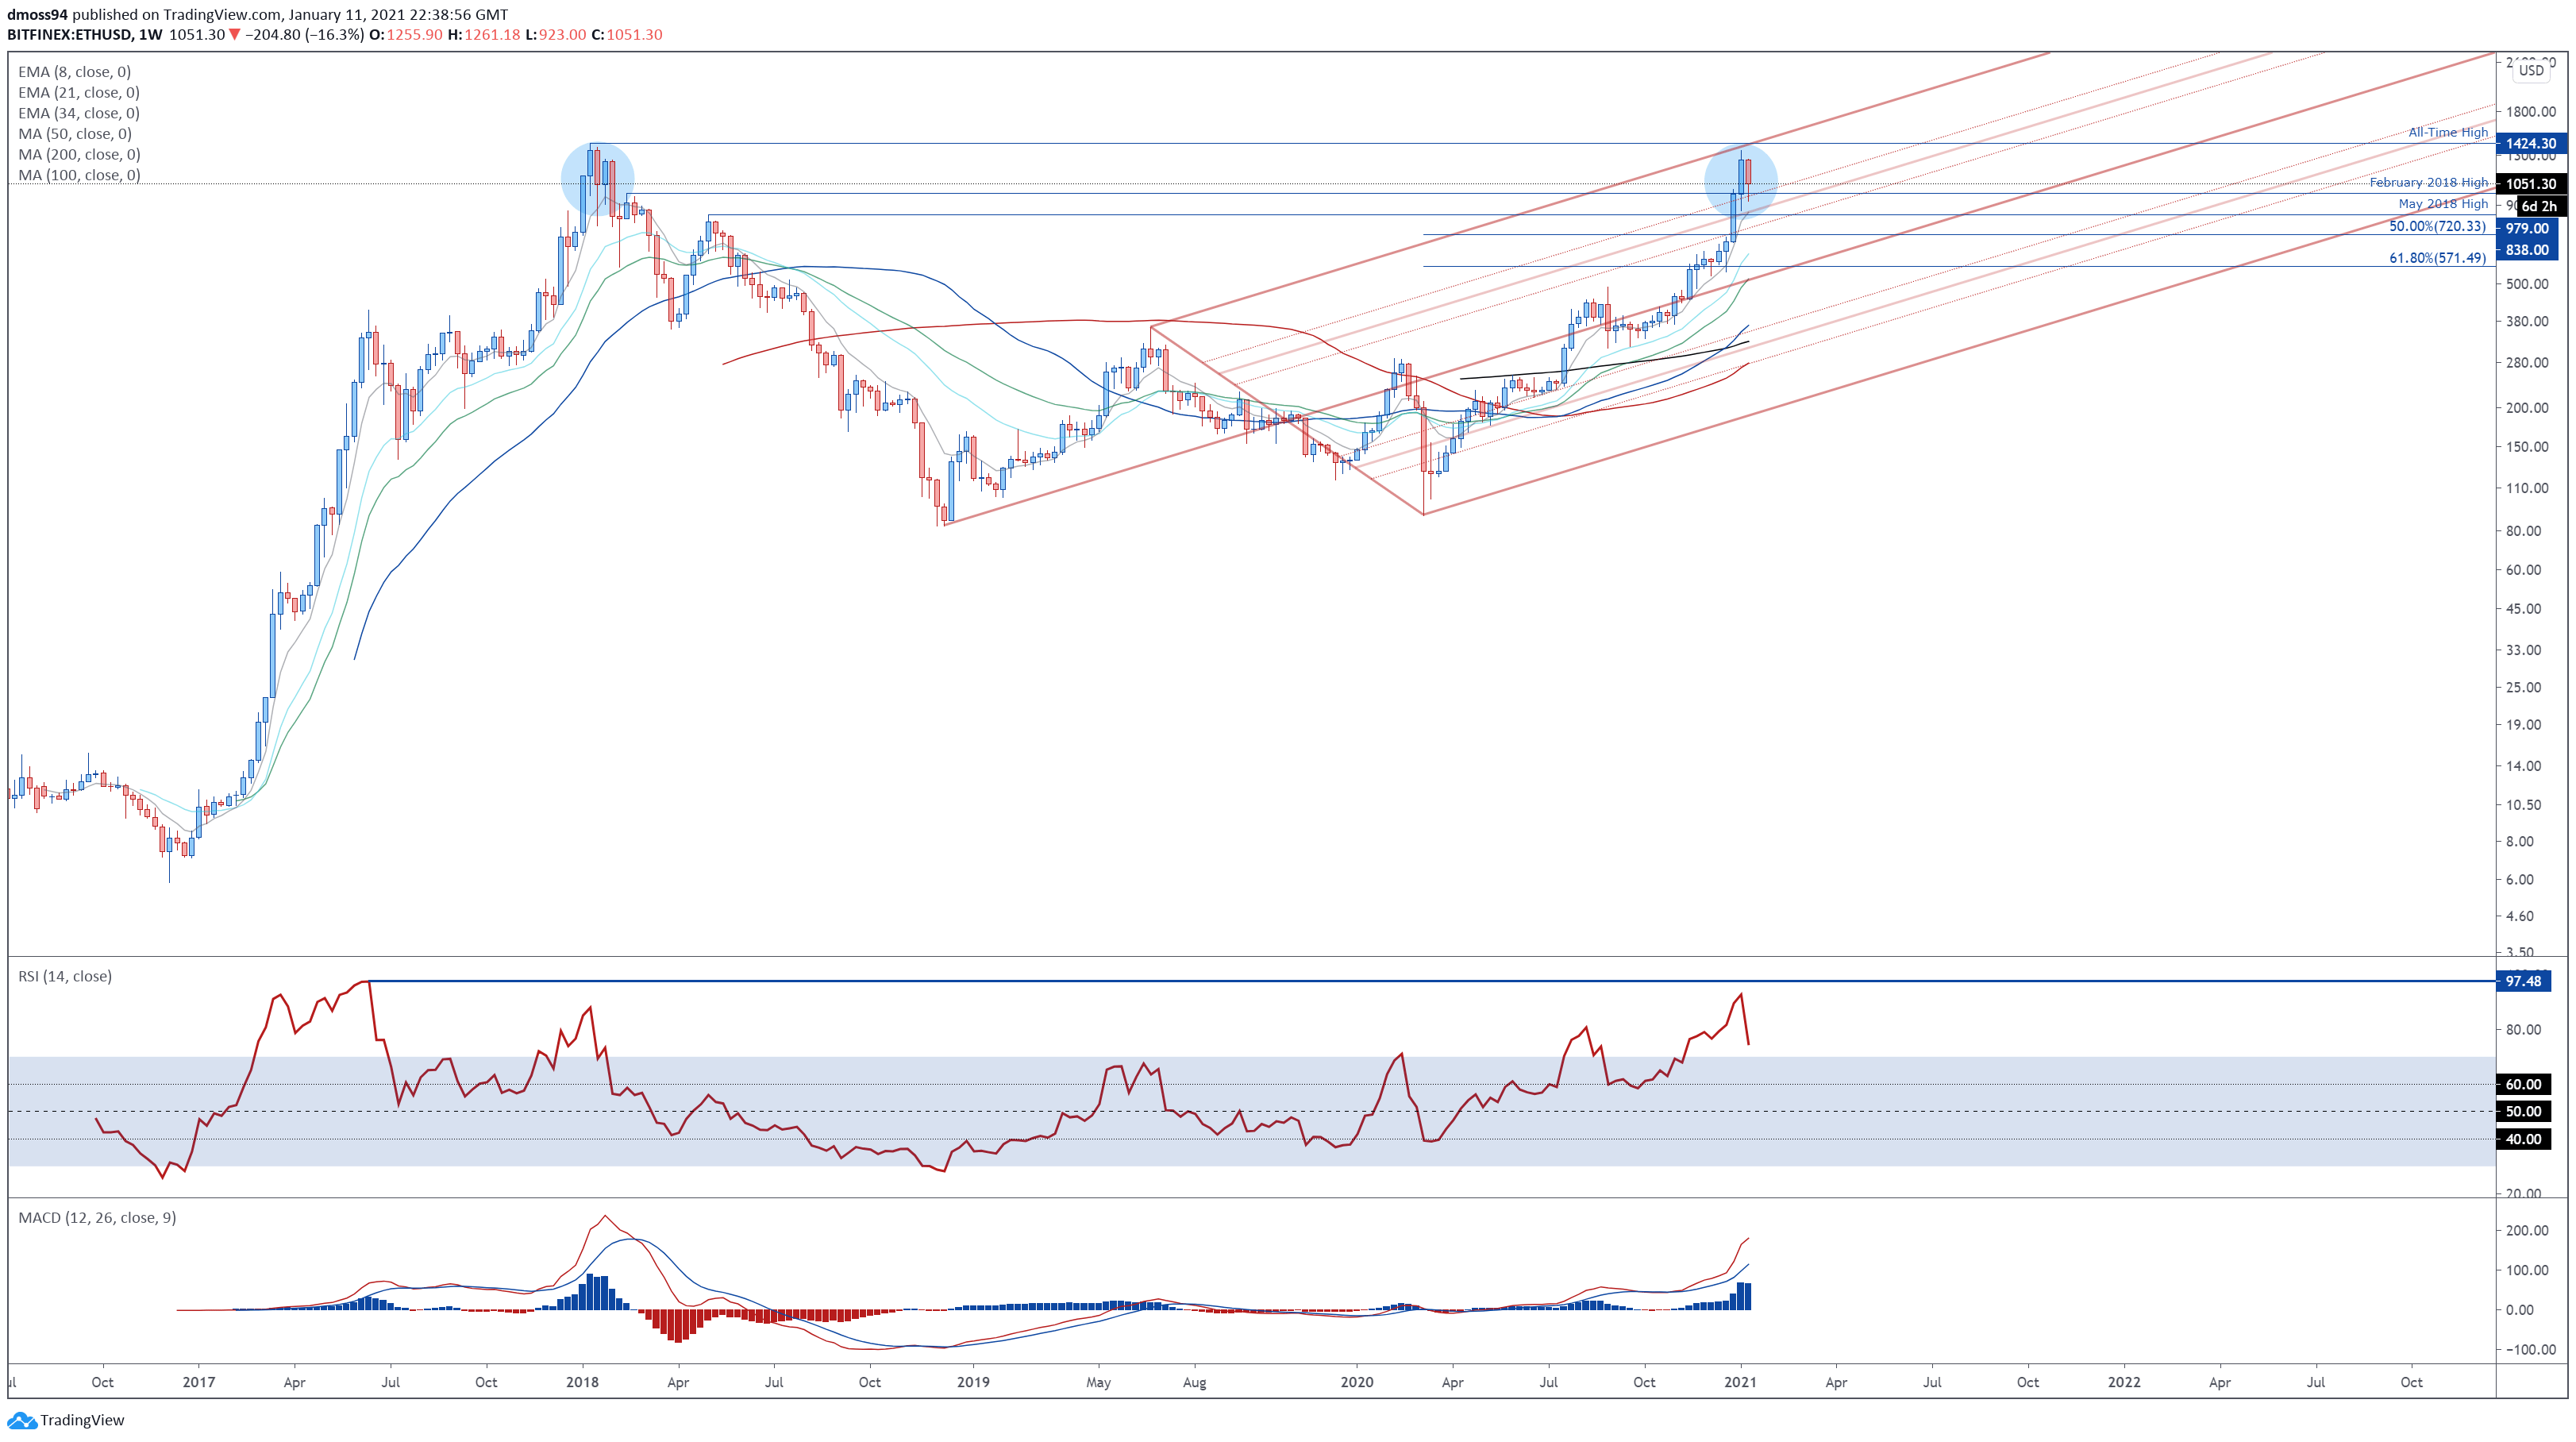
Ethereum weekly chart created using Tradingview
Ethereum’s 1407% surge higher from the March 2020 low (89.66) also looks in jeopardy as prices form a bearish Hanging Man reversal candle just shy of confluent resistance at the Pitchfork parallel and record high set in early 2018 (1424).
In fact, the inability of price to push to fresh record highs suggests that a Double Top reversal pattern could be in play.
Sliding back below the February 2018 high (979) would likely precipitate a more extensive downside move back towards the 50% Fibonacci, with a convincing break below bringing the Pitchfork median and 61.8% Fibonacci into focus.
Conversely, a push to challenge the record high could be on the cards if price remains constructively perched above psychological support at $1000.
Ethereum (ETH) Daily Chart – 8-EMA Capping Upside
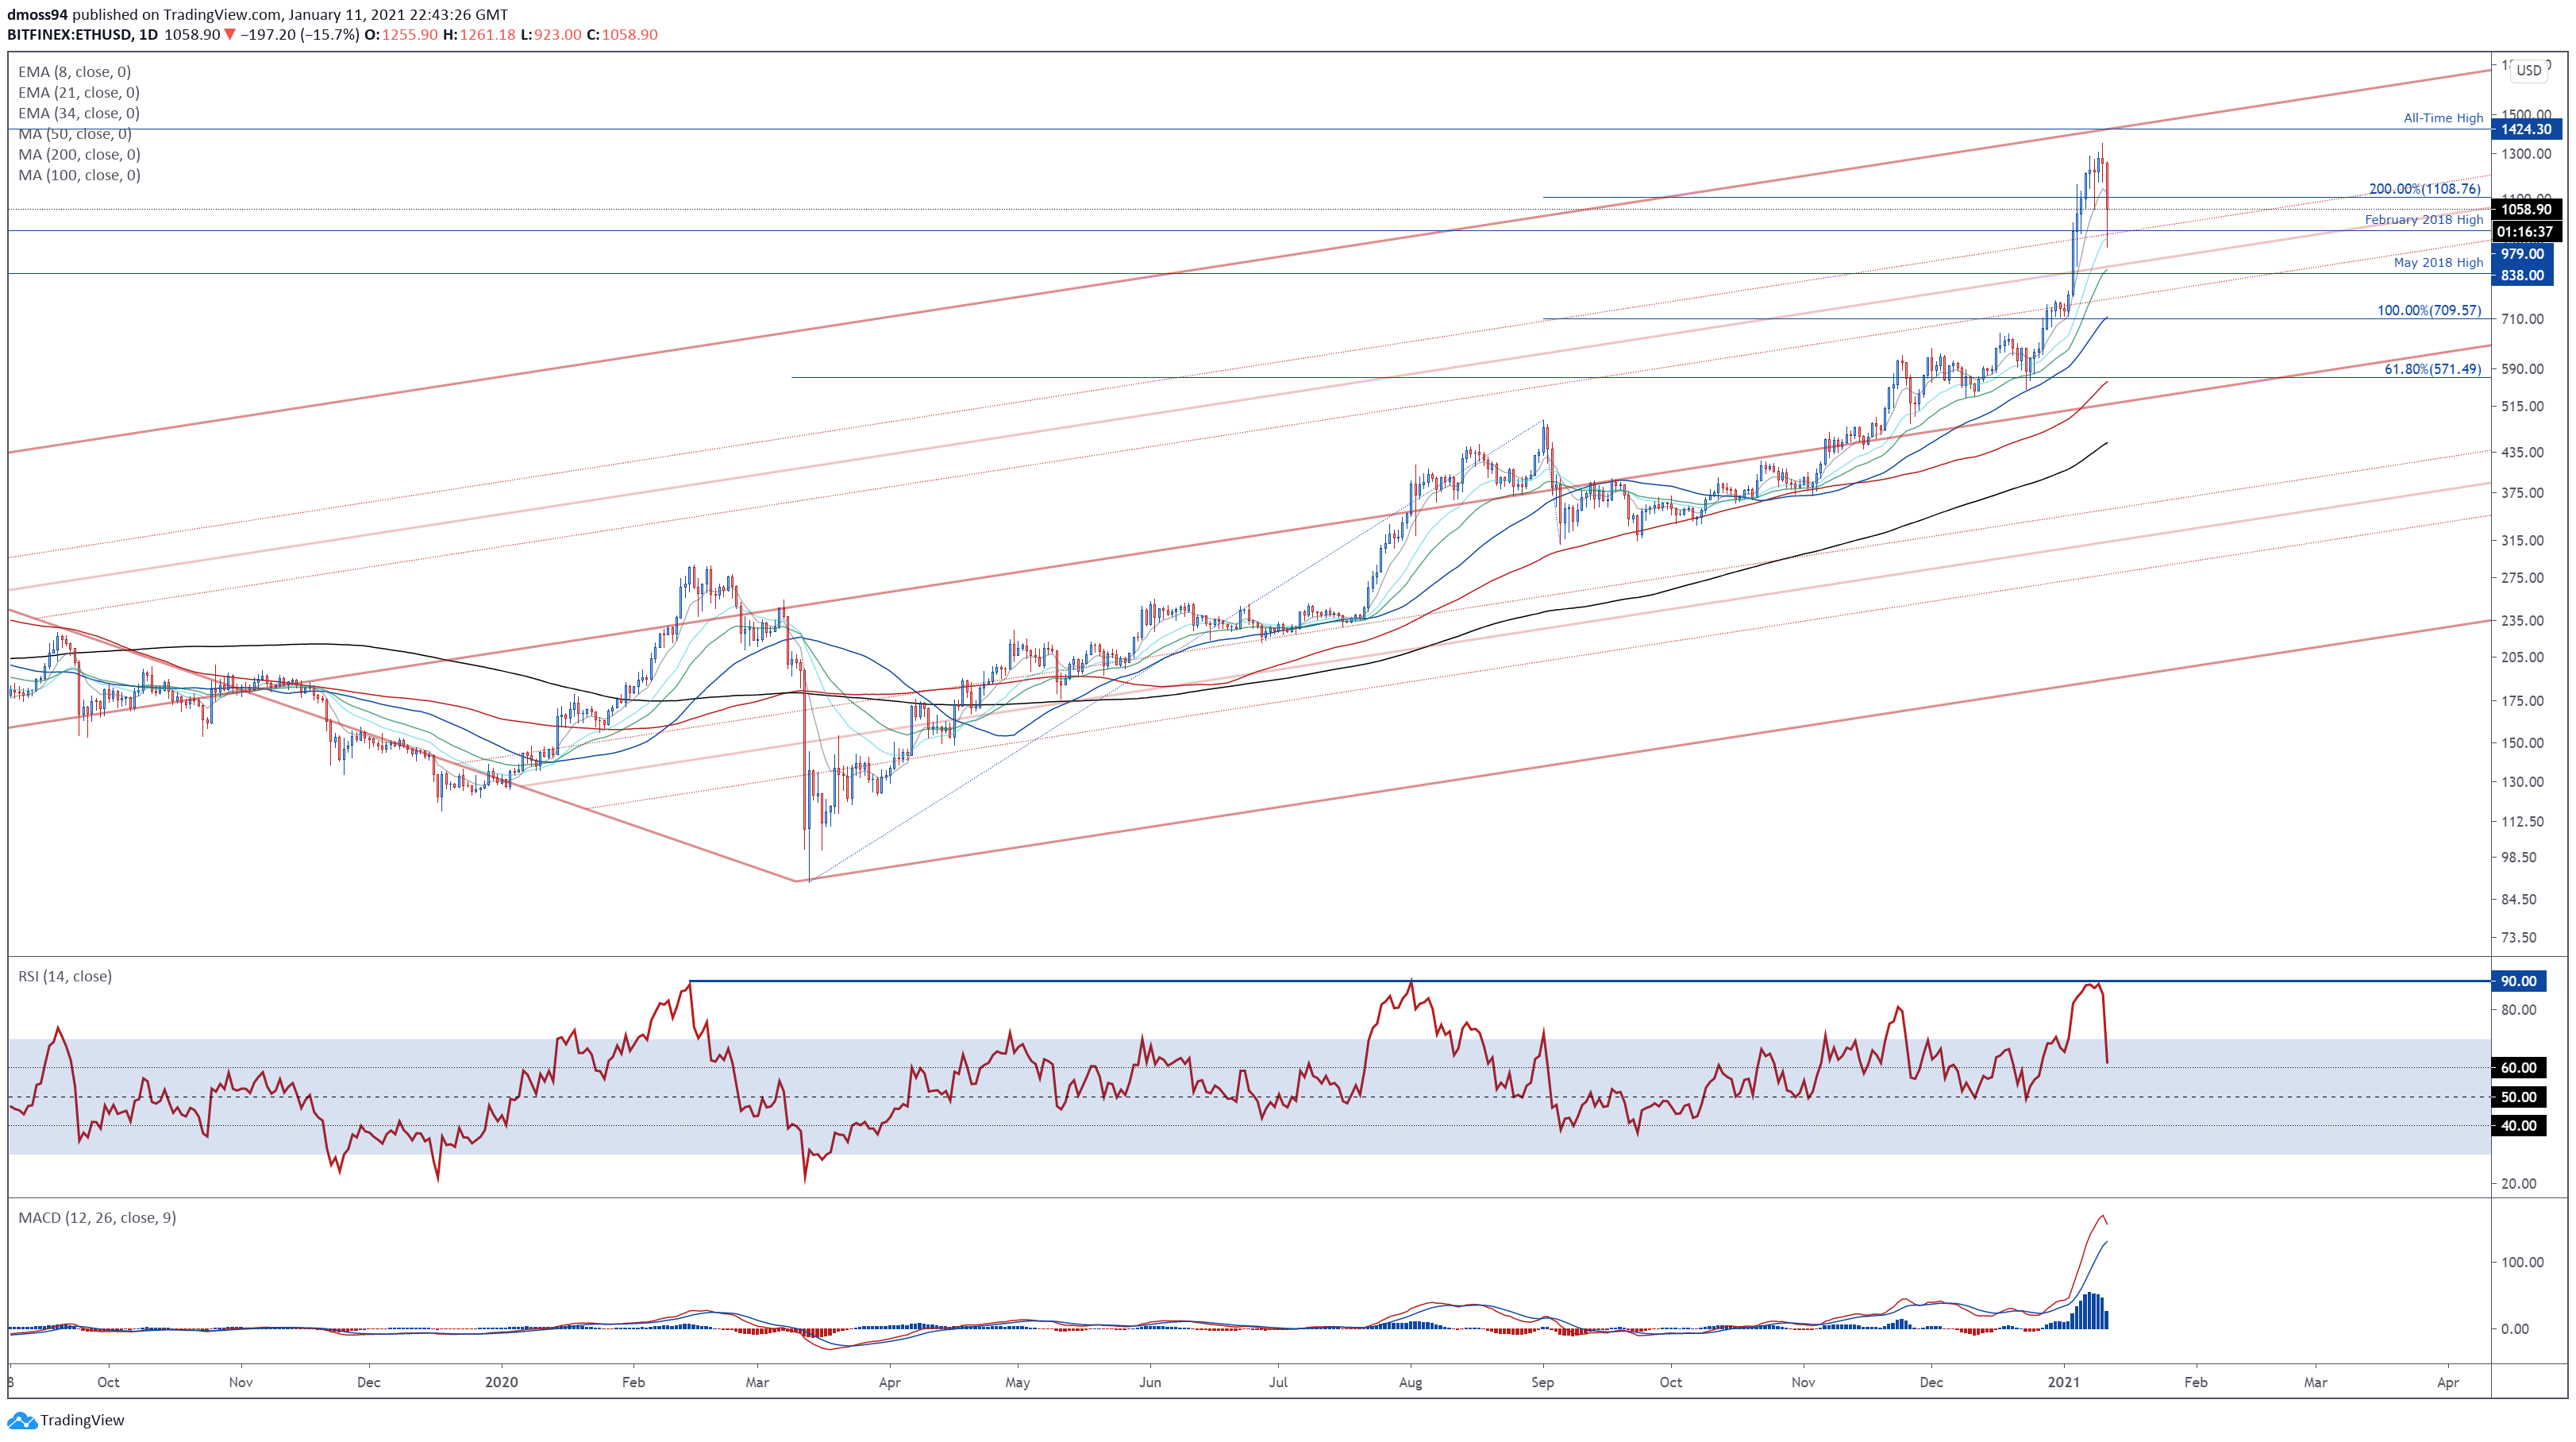
Ethereum daily chart created using Tradingview
The daily timeframe also suggests that further losses are at hand for the second-most popular cryptocurrency, as sellers drive price back below the 200% Fibonacci expansion (1108) and 8-day EMA (1125).
The RSI’s marked slide back below 70, after surging to its most extreme levels since late July 2020, hints at swelling bearish momentum and could ultimately encourage further selling in the near term if the February 2018 high (979) gives way.
A daily close back below $950 likely intensifies bearish momentum and carves a path for price to challenge confluent support at the 34-EMA (850) and Pitchfork 50% parallel. Hurdling that probably sparks a downside move back towards the December 2020 high (757).
On the contrary, a daily close back above $1100 could allow buyers to regain control and drive price back towards the yearly high (1351).
| Change in | Longs | Shorts | OI |
| Daily | 6% | -23% | 4% |
| Weekly | 3% | -36% | -1% |
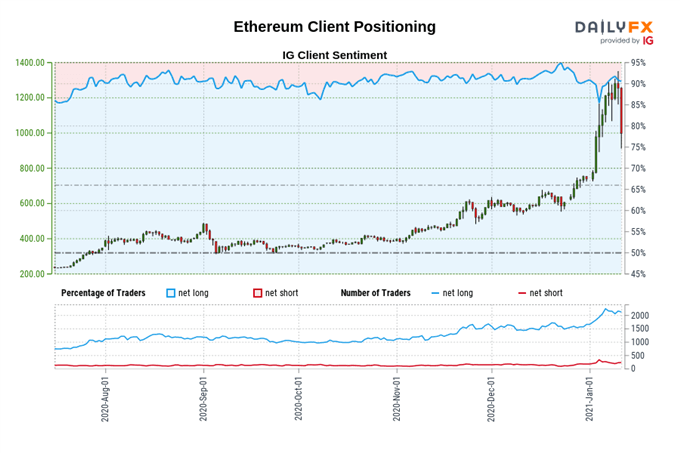
The IG Client Sentiment Report shows 92.44% of traders are net-long with the ratio of traders long to short at 12.22 to 1. The number of traders net-long is 11.23% lower than yesterday and 0.10% higher from last week, while the number of traders net-short is 25.81% lower than yesterday and 40.37% lower from last week.
We typically take a contrarian view to crowd sentiment, and the fact traders are net-long suggests Ethereum prices may continue to fall.
Traders are further net-long than yesterday and last week, and the combination of current sentiment and recent changes gives us a stronger Ethereum-bearish contrarian trading bias.
— Written by Daniel Moss, Analyst for DailyFX
Follow me on Twitter @DanielGMoss

Recommended by Daniel Moss
Improve your trading with IG Client Sentiment Data


